What are data-driven displays? Signage impact in 2026
- Data-driven displays automatically update content based on real-time or scheduled data inputs.
- They enhance engagement and operational efficiency across retail, corporate, healthcare, and hospitality sectors.
- Implementing and continuously optimizing these displays requires strategic integration, testing, and measuring impact.
Not all digital signage is the same. A screen cycling through the same five slides every hour is fundamentally different from a display that pulls live inventory data, adjusts messaging based on audience demographics, and swaps content automatically when the weather changes. Data-driven displays represent a major shift in how organizations communicate, and for marketing managers and communication professionals, that shift opens up real, measurable opportunities. This article breaks down what data-driven displays are, how they work, and how your organization can start using them to make every screen count.
Table of Contents
- Understanding data-driven displays
- How data-driven digital signage works
- Key benefits and use cases for marketing communication
- Implementing data-driven displays in your organization
- Why most organizations miss the full potential of data-driven displays
- Elevate your digital signage with DST Connect
- Frequently asked questions
Key Takeaways
| Point | Details |
|---|---|
| Dynamic content advantage | Data-driven displays update in real time, allowing more relevant messaging compared to static screens. |
| Improved engagement | Audiences are more likely to notice and respond to signs powered by real-time data. |
| Organizational flexibility | Marketing managers can quickly adapt campaigns and internal communications using data-driven signage. |
| Measurable results | Data-driven displays make it easier to track impact and optimize content strategies for better ROI. |
Understanding data-driven displays
A data-driven display is a digital screen whose content is controlled, updated, or triggered by real-time or scheduled data inputs rather than manually uploaded static files. Instead of a fixed playlist, the screen responds to information: a retail store shows current promotions based on inventory levels, a hospital lobby updates wait times automatically, or a corporate office displays live KPI dashboards for the team.
The core difference from traditional digital signage is responsiveness. Static or non-data-driven displays require someone to log in, update a file, and push it to the screen. Data-driven displays do that work automatically, pulling from connected sources and refreshing content without manual intervention.
Common data inputs that power these displays include:
- Scheduling systems: Content changes based on time of day, day of week, or calendar events
- Weather feeds: Messaging adapts to current or forecasted conditions
- Audience analytics: Sensors or camera-based tools detect demographic data and adjust content accordingly
- Inventory or CRM systems: Product availability, pricing, or customer data drives what appears on screen
- Social media and news feeds: Live content streams keep displays fresh and relevant
The growing demand for digital signage is closely tied to this shift toward dynamic, data-connected content. Organizations that have moved beyond static displays report stronger audience engagement and more efficient content management.
Data-driven displays are also a natural fit for digital signage for announcements, where timeliness is critical. An emergency alert, a last-minute schedule change, or a flash promotion all benefit from instant, automated delivery.
Pro Tip: Think beyond basic slideshows. Set up data triggers so your screens show the right message at the right moment, without anyone manually touching the system. Even a simple time-based rule (show lunch specials between 11am and 2pm) is a meaningful step toward data-driven signage.
How data-driven digital signage works
Understanding the mechanics helps you make smarter decisions about tools and workflows. At its core, data-driven signage connects three layers: a data source, a content management system (CMS), and the display hardware.
Here is a simplified view of how data flows through a typical setup:
| Layer | Component | Example |
|---|---|---|
| Data source | External system or feed | Weather API, inventory database, scheduling tool |
| Integration | CMS or middleware | DST Connect, API connector, data feed plugin |
| Output | Display hardware | Android media player, Windows screen, OLED display |
| Trigger | Rule or condition | Time of day, stock level below threshold, sensor input |
The digital signage demand insights show that organizations increasingly expect their signage software to handle integrations natively, reducing reliance on IT teams for routine updates.
For marketing teams, the typical workflow looks like this:
- Define your data sources: Identify which systems hold the information you want to display (inventory, CRM, scheduling tools)
- Connect data to your CMS: Use built-in integrations or API connectors to link the data source to your signage platform
- Build content templates: Design layouts that include dynamic fields, so data populates automatically
- Set triggers and rules: Decide what conditions cause content to change (time, data threshold, location)
- Publish and monitor: Push content to screens and track performance through your CMS dashboard
To optimize displays for maximum impact, the template design matters as much as the data. A well-structured display templates guide can help you build layouts that look professional and adapt cleanly as data changes.

Pro Tip: Automate routine content updates from day one. Manual updates introduce delays and errors. If your team is still logging in to change daily specials or event schedules by hand, that is the first process to automate.
Key benefits and use cases for marketing communication
For marketing managers and communication professionals, the case for data-driven displays comes down to three core benefits: relevance, efficiency, and measurable impact.
Relevance is the biggest win. A message that matches the current context (time, location, audience, or event) performs better than a generic one. Digital signage statistics consistently show that dynamic content outperforms static content in recall and engagement.
Organizations using dynamic digital signage report significantly higher audience engagement compared to those relying on static content, with some studies citing uplift of 40% or more in message retention.
Here is how different sectors apply data-driven displays:
- Retail: Promotions update automatically based on stock levels or time of day, reducing wasted ad spend on out-of-stock items
- Corporate communications: Live KPI dashboards, HR announcements, and meeting room availability displays keep employees informed without manual updates
- Hospitality: Guest-facing screens show real-time dining menus, event schedules, and local weather, directly enhancing guest experience
- Healthcare: Wait time displays, appointment reminders, and health tips update automatically from scheduling systems
Interactive display examples show that adding a data layer to touchscreen or sensor-enabled displays takes engagement even further, allowing audiences to access personalized information on demand.
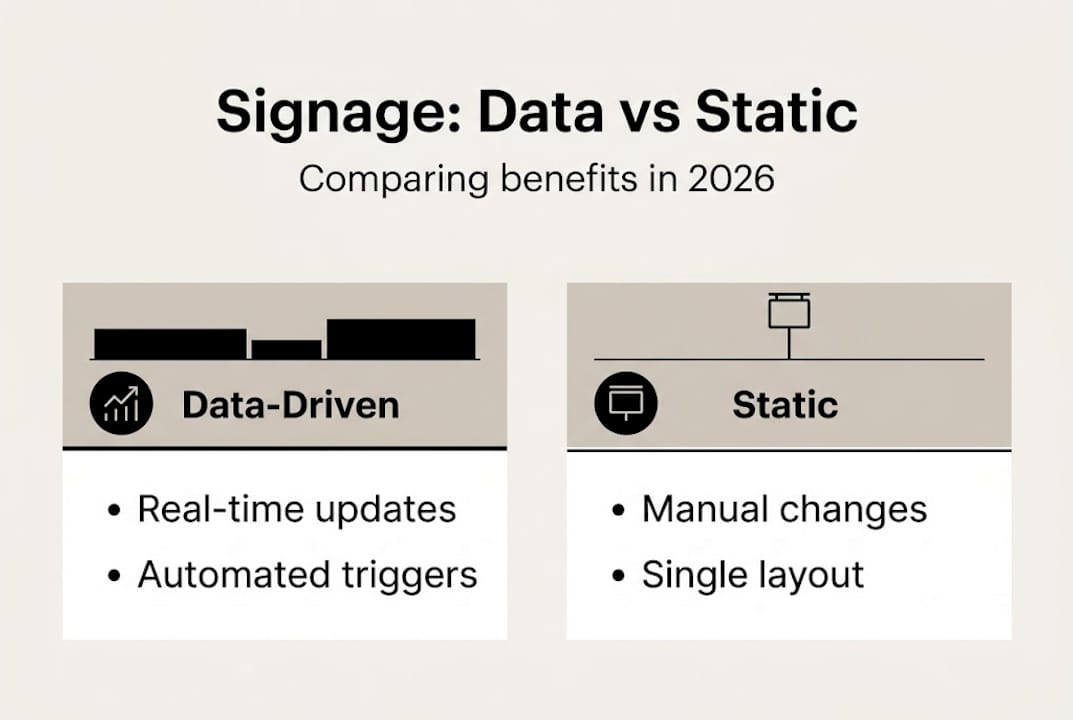
| Feature | Data-driven signage | Static signage |
|---|---|---|
| Content updates | Automatic, real-time | Manual, scheduled uploads |
| Relevance | Context-aware | Fixed messaging |
| Audience targeting | Demographic or behavioral | Broad, untargeted |
| Operational effort | Low after setup | Ongoing manual work |
| Engagement potential | High | Moderate to low |
The efficiency gains are just as significant as the engagement benefits. Once your data connections and templates are in place, your team spends less time managing screens and more time refining strategy.
Implementing data-driven displays in your organization
Getting started does not require a full infrastructure overhaul. A structured approach helps you move from concept to live screens without unnecessary complexity.
- Assess your current setup: Audit existing screens, hardware, and any CMS already in use. Identify gaps in data connectivity and content freshness.
- Choose your data sources: Start with one or two high-value inputs, such as a scheduling system or a product feed, rather than trying to connect everything at once.
- Select the right software: Your CMS needs to support data integrations natively or through API connections. Look for platforms that offer real-time feed support and template-based content creation.
- Build a pilot: Choose one location or screen group for your first data-driven deployment. Test the data connection, content triggers, and display output before scaling.
- Measure and iterate: Define success metrics upfront (engagement rate, content accuracy, team time saved) and review them after the pilot.
Signage automation tools can significantly reduce the manual workload during and after rollout. Pairing automation with a clear content strategy ensures your screens stay relevant without constant oversight.
Privacy and compliance are worth addressing early. If your displays use audience analytics or sensor data, ensure your data collection practices align with applicable regulations such as GDPR or CCPA. Document your data sources and retention policies before going live.
For organizations new to dynamic content, the interactive signage guide offers a practical overview of how to layer interactivity and data for more sophisticated experiences.
Pro Tip: Start your pilot in a high-traffic, high-visibility location. The faster you collect real-world feedback, the faster you can refine your content rules and data triggers before rolling out to the full network.
Bullet checklist before launch:
- Hardware is compatible with your chosen CMS
- Data sources are connected and tested
- Content templates include dynamic fields
- Triggers and scheduling rules are defined
- Privacy and compliance review is complete
- Success metrics are documented
Why most organizations miss the full potential of data-driven displays
Here is an honest observation: most organizations that invest in data-driven signage stop at the technical setup and never fully realize the strategic value. They connect a data feed, automate a few updates, and then treat the screens as a solved problem.
The real opportunity is in ongoing optimization. Data-driven displays give you a feedback loop. You can see what content runs when, correlate it with sales or engagement data, and adjust your messaging rules accordingly. That is a capability most teams leave unused.
The other common misstep is disconnecting display content from actual business KPIs. If your screens are not tied to goals like conversion rate, employee awareness, or customer satisfaction, you have no basis for improvement.
Pro AV tips for signage consistently point to the same lesson: the organizations that get the most from their displays are the ones that treat content as a living strategy, not a one-time project. Set it and forget it is the fastest way to waste your signage investment.
Pro Tip: Start small, iterate fast, and measure ROI from the first week. Even basic metrics like content uptime and schedule accuracy tell you whether your data connections are working as intended.
Elevate your digital signage with DST Connect
DST Connect is built to make data-driven digital signage accessible for organizations of every size. The platform supports real-time data feeds, automated scheduling, and a drag-and-drop editor with over 600 professionally designed templates, so your team can build dynamic displays without needing technical expertise.
Whether you are setting up your first data-connected screen or scaling across multiple locations, DST Connect provides the tools to do it efficiently. Explore compatible digital signage hardware to find the right setup for your environment, and follow the step-by-step signage setup guide to get your first data-driven display live quickly. Ready to move beyond static screens? Try DST Connect and see the difference dynamic content makes.
Frequently asked questions
What types of data can be used in data-driven displays?
Data-driven displays can use multiple data sources including weather feeds, news, schedules, inventory levels, and real-time audience analytics to tailor content automatically.
Are data-driven displays more effective than static signage?
Yes. Dynamic digital signage consistently delivers higher engagement and better audience targeting than static content, with organizations reporting measurable improvements in message retention.
What is required to implement data-driven digital signage?
You need compatible display hardware, at least one data input source, and a CMS that supports data integration and automated content updates.
How do I measure ROI of data-driven displays?
Track engagement and real-time data through your signage platform’s analytics tools, and correlate display performance with business outcomes like sales lift, employee awareness, or customer satisfaction scores.
Recommended
Enjoyed this blog?
Continue with the previous or next article and discover more ideas, insights and inspiration from DST Connect.