What is a cloud dashboard? Visualizing metrics in real time
TL;DR:
- Cloud dashboards provide real-time, centralized visibility over digital signage networks and content.
- They enable faster decision-making, collaboration, and campaign agility across multiple locations.
- Implementing structured governance enhances ROI and ensures secure, scalable management of digital signage.
Most digital marketing teams think of dashboards as glorified spreadsheets with nicer colors. A grid of numbers, maybe a bar chart or two, and a pie chart that nobody really uses. That mental model is costing organizations real money and agility. Cloud dashboards are something categorically different: they are live command centers that give your team centralized visibility over every display, every content update, and every device status signal across your entire network, from a single browser window, at any moment.
Table of Contents
- What is a dashboard? (Visual foundations)
- How cloud dashboards work
- Key features of cloud dashboards for digital signage
- Benefits and challenges of using cloud dashboards
- Why cloud dashboards change the stakes for digital signage
- Elevate your digital signage with DST Connect cloud dashboard solutions
- Frequently asked questions
Key Takeaways
| Point | Details |
|---|---|
| Centralized management | Cloud dashboards let you control and update digital signage networks from anywhere in real time. |
| Visual clarity | Dashboards aggregate key metrics so your team can monitor performance and react faster. |
| Scalability | Cloud-based interfaces easily scale with your business as your signage footprint grows. |
| Enhanced collaboration | Real-time cloud tools empower marketing, IT, and content teams to work together seamlessly. |
| Security and compliance | Leading solutions offer solid access controls and auditing for enterprise-scale content governance. |
What is a dashboard? (Visual foundations)
Having framed the promise of cloud dashboards, let’s get clear on what dashboards are at their core.
According to the dashboard interface overview published by Gartner, a dashboard aggregates key metrics and presents them visually for at-a-glance decision-making. That definition sounds simple, but it carries a lot of weight. The critical word is “aggregates.” A dashboard does not just display one data point. It pulls together dozens of signals from different sources and makes them legible at a glance.
For digital marketing managers, this means you can look at one screen and instantly understand which displays are live, which campaigns are running, and where performance is lagging. That kind of consolidated visibility was genuinely difficult to achieve before cloud-based systems became mainstream.
“A dashboard is a visual interface that aggregates key metrics and indicators and presents them for at-a-glance understanding and decision-making.” — Gartner
Think of digital notice boards as the physical expression of this idea: curated, purposeful information displayed where it matters most. A cloud dashboard is the management layer that makes those displays work intelligently.
Key elements you will find in a well-designed dashboard:
- Real-time data feeds: Live connections to content management systems, device APIs, or analytics platforms
- Alert indicators: Visual flags for device outages, scheduling conflicts, or content errors
- Trend visualizations: Line graphs and bar charts showing content performance over time
- Summary panels: High-level KPI summaries that collapse complex data into scannable metrics
- Filtering and segmentation controls: Tools that let you drill down by location, device type, or campaign
Each of these elements serves a specific cognitive function. They reduce the mental load on your team so decisions happen faster and with more confidence.
How cloud dashboards work
Now that we understand dashboards fundamentally, let’s see how the cloud transforms their structure and operation.

A traditional dashboard lives on a server inside your building. Updating it requires someone with database access, often a developer, and the data is only as fresh as the last manual refresh. Cloud dashboards break that model entirely. As Microsoft Power BI explains, a cloud-delivered dashboard is managed via cloud-hosted services where the underlying data and resources are updated and accessed over the internet continuously.
Mechanically, the architecture works like this: visual components called tiles or panels connect to live data sources. When data changes at the source, the tile updates automatically. In digital signage specifically, those data sources include your content scheduling system, device health monitors, and campaign analytics tools. According to Splunk’s documentation on dashboard mechanics, dashboard tiles in cloud deployments connect to data sources where content governance, scheduling, and monitoring are all delivered through cloud services rather than local infrastructure.
For teams managing multi-screen management across large networks, this architecture is a game changer. You no longer need an IT technician on site at each location to push a content update or troubleshoot a display issue.
Comparison: On-premises dashboards vs. cloud dashboards
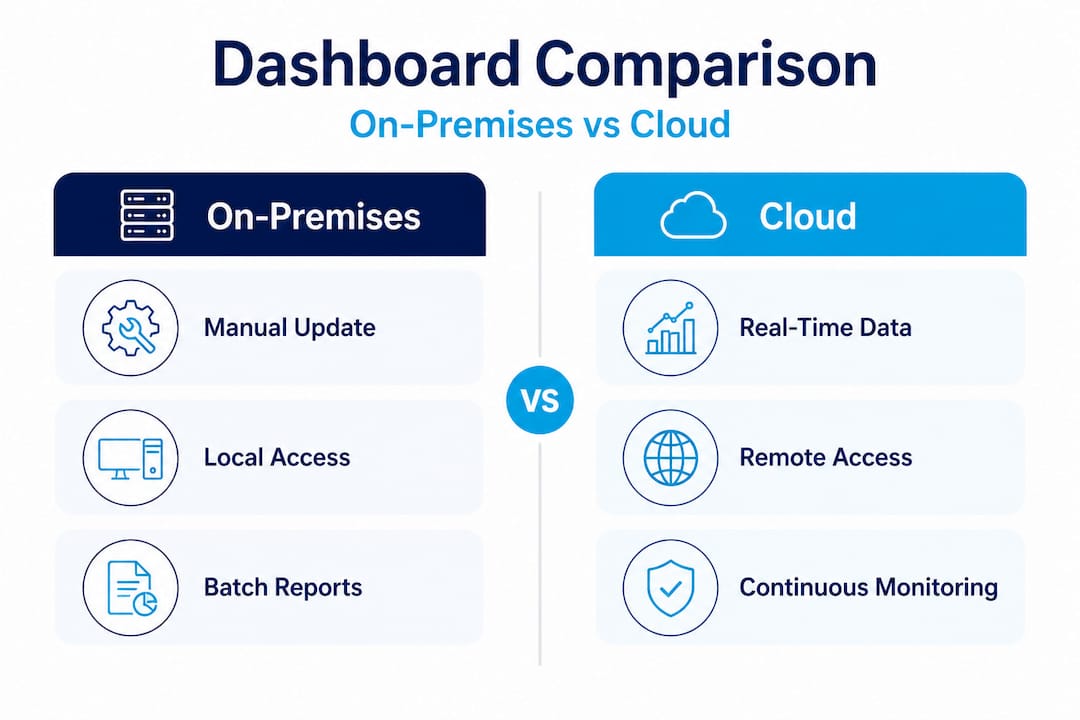
| Feature | On-premises | Cloud |
|---|---|---|
| Update speed | Manual or scheduled batch | Real-time, continuous |
| Accessibility | Local network only | Anywhere with internet access |
| Scalability | Hardware-limited | Elastic, scales on demand |
| User management | IT-managed, complex | Role-based, self-service |
| Setup cost | High upfront capital | Subscription-based, lower entry cost |
| Maintenance | Internal IT team required | Vendor-managed infrastructure |
| Collaboration | Single-location teams | Cross-department, cross-geography |
The differences are not marginal. They represent a fundamental shift in how your content team operates day to day.
Pro Tip: When evaluating cloud dashboard solutions, verify that your vendor supports granular role-based access controls. Remote teams need the ability to manage their regional content without accidentally overwriting campaigns owned by other departments. Secure, scalable access is not a bonus feature; it is a baseline requirement.
Key features of cloud dashboards for digital signage
With the mechanics clear, let’s highlight the specific features that matter most for managing modern signage networks.
Not every cloud dashboard feature matters equally for digital signage professionals. Business intelligence dashboards and digital signage dashboards share common DNA, but their priorities diverge. Here is what specifically matters for your use case.
As Microsoft Power BI’s guidance on cloud digital signage management notes, centralized cloud workflows for scheduling, publishing, and monitoring device status across screens are the defining capabilities that separate cloud-native signage platforms from legacy systems.
Top 5 features critical for digital signage cloud dashboard management:
- Centralized content scheduling: Build and manage your entire content calendar from one interface. Assign specific playlists to specific screens or groups of screens, schedule time-sensitive promotions, and set expiration dates so outdated content never runs longer than intended.
- Device status and health monitoring: Know instantly which screens are online, which are offline, and which are showing errors. For large networks, this transforms what used to be a support ticket backlog into a proactive management workflow.
- Role-based access and permission controls: Assign editing rights, approval workflows, and publishing permissions by user role. A regional marketing coordinator can update their local screens without touching the corporate brand templates.
- Real-time analytics and performance reporting: Track which content is running on which screens, measure engagement where sensors or integrations allow, and correlate campaign timing with business outcomes. Understanding what performs best is how you improve every future campaign.
- Multi-location content governance: Apply brand standards globally while allowing local customization within approved parameters. This is especially valuable for enhancing guest experience in hospitality, retail, and healthcare environments where brand consistency matters enormously.
Exploring signage concepts for marketers can help your team build a stronger conceptual framework before finalizing your platform requirements. The more your team understands about cloud signage architecture, the better your vendor conversations will be.
Benefits and challenges of using cloud dashboards
Understanding feature sets is foundational, but weighing real-world benefits and trade-offs is where purchase decisions are made.
Cloud dashboards for digital signage deliver clear advantages. But they also come with challenges that organizations sometimes discover too late in the deployment process. Being honest about both sides leads to better adoption and stronger long-term ROI.
Cloud dashboards allow marketers to consolidate content, monitor screen health, adapt quickly to campaign results, and centralize compliance. That capacity to adapt quickly is particularly valuable in fast-moving retail or event-driven contexts where campaign timing is tightly linked to business performance.
Benefits vs. challenges: A realistic comparison
| Dimension | Benefit | Challenge |
|---|---|---|
| Scalability | Easily add screens and locations | Requires disciplined content governance at scale |
| Cost | Lower upfront hardware and IT costs | Ongoing subscription fees add up for large networks |
| Accessibility | Manage displays from anywhere | Internet dependency can create outage risk |
| Speed | Real-time content updates across all screens | Poorly planned workflows can cause unintended overwrites |
| Security | Vendor-managed encryption and access controls | Data sensitivity requires careful vendor due diligence |
| Collaboration | Cross-team and cross-location editing | User permission sprawl if access is not regularly audited |
Looking at interactive menu board examples is a useful exercise for understanding how cloud scheduling features translate to real customer-facing results in high-volume environments like restaurants and retail chains.
For organizations in the hospitality sector, digital signage in hotels demonstrates how cloud-managed displays can simultaneously serve guests in the lobby, staff in back-of-house areas, and management teams reviewing performance metrics, all from one dashboard.
Reviewing how Splunk defines dashboard mechanics can also help technical stakeholders understand the underlying architecture before committing to a platform.
Practical tips for smooth cloud dashboard adoption:
- Start with a clear governance model before you configure anything. Define who owns what content, which teams can publish, and what the approval process looks like.
- Audit your existing hardware inventory for compatibility with cloud-based signage players before purchasing new infrastructure.
- Train end users on the dashboard interface before launch day. A well-designed platform is only effective if your team knows how to use it confidently.
- Build in a testing period with a small group of screens before rolling out across your full network.
- Establish a regular review cadence for content performance data so insights actually inform future decisions rather than sitting in reports nobody reads.
Pro Tip: Schedule a quarterly access audit for your cloud dashboard. User roles and permissions accumulate over time, especially in organizations with staff turnover. Unused accounts and overly broad permissions are both a security risk and a governance liability. A clean, well-maintained user list keeps your platform secure and your workflows predictable.
Why cloud dashboards change the stakes for digital signage
The discussion so far has emphasized features and benefits. Now let’s get honest about what changes with cloud dashboards in the real world, particularly what most organizations get wrong.
The biggest missed opportunity we see is collaboration. Most teams treat a cloud dashboard as a convenience tool for remote access. They think of it as “the old dashboard, but accessible from my laptop at home.” That framing undersells the technology by a wide margin.
Cloud dashboards fundamentally change who participates in content decisions and how fast those decisions happen. When a marketing coordinator in one city can see the same live scheduling view as a brand manager at headquarters, the dynamic shifts. Decisions that previously required emails, screenshot attachments, and two-day approval chains can happen in a single conversation while both parties look at the same interface. According to Splunk’s research on dashboard mechanics, cloud-enabled dashboard workflows can reshape content team collaboration in ways that physical, on-premises systems never could.
The second undervalued advantage is agility in campaign management. Digital signage campaigns tied to events, weather, promotions, or inventory levels need to change quickly. A cloud dashboard with solid scheduling tools lets your team pivot content strategy in minutes rather than days. That responsiveness creates a measurable competitive edge in retail, food service, and event environments where timing is everything.
The hard-won lesson from enterprise deployments is this: organizations that invest time upfront in governance models consistently realize higher ROI from cloud dashboards than those that rush into deployment without a plan. The technology is not the obstacle. The workflow design is. Building a strong cloud signage strategy before you configure your platform pays dividends for years.
Teams that define ownership, approval processes, and content hierarchies before launch spend far less time cleaning up conflicts and far more time optimizing results.
Elevate your digital signage with DST Connect cloud dashboard solutions
With the strategic importance of cloud dashboards established, here is how DST Connect helps you put these principles into action.
DST Connect is built specifically for organizations that need to manage digital signage at scale without requiring a technical team to do it. The platform’s cloud dashboard gives marketing managers and content creators centralized control over scheduling, device health monitoring, and multi-screen content governance, all from an intuitive interface. With over 600 professionally designed templates and a drag-and-drop editor, your team can publish polished, brand-consistent content to any screen in your network within minutes. Explore compatible digital signage hardware to find the right setup for your locations, and use the detailed setup guide to get your network running quickly. Request a demo today and see how DST Connect turns cloud dashboard theory into real results.
Frequently asked questions
What is the main purpose of a cloud dashboard?
A cloud dashboard lets you view, control, and analyze digital signage content and device status in real time from anywhere, because as Microsoft Power BI notes, cloud-hosted dashboard resources are updated and accessed continuously over the internet.
How does a cloud dashboard differ from traditional dashboards?
Cloud dashboards use web-based services for live updates and remote access, while traditional dashboards are tied to on-premises infrastructure and typically require manual data refreshes to stay current.
What kind of data can I see in a digital signage cloud dashboard?
You can track content scheduling, screen status, campaign performance, and device health from a single interface, since cloud signage workflows cover scheduling, publishing, and device monitoring across your entire screen network.
Are cloud dashboards secure for sensitive content?
Most reputable cloud dashboard platforms offer strong security controls including role-based access permissions, end-to-end encryption, and compliance support that meet enterprise-grade standards.
Can cloud dashboards scale for multi-location signage networks?
Yes, cloud dashboards are purpose-built for scaling across multiple displays and sites, because centralized cloud workflows handle scheduling, publishing, and monitoring across large distributed networks without requiring on-site infrastructure at each location.
Recommended
Enjoyed this blog?
Continue with the previous or next article and discover more ideas, insights and inspiration from DST Connect.