Digital signage ROI: maximize value for your organization
TL;DR:
- Digital signage delivers an average sales increase of 29.5% with up to 400% ROI in the first year.
- Effective ROI measurement includes both direct financial gains and operational benefits like engagement and cost savings.
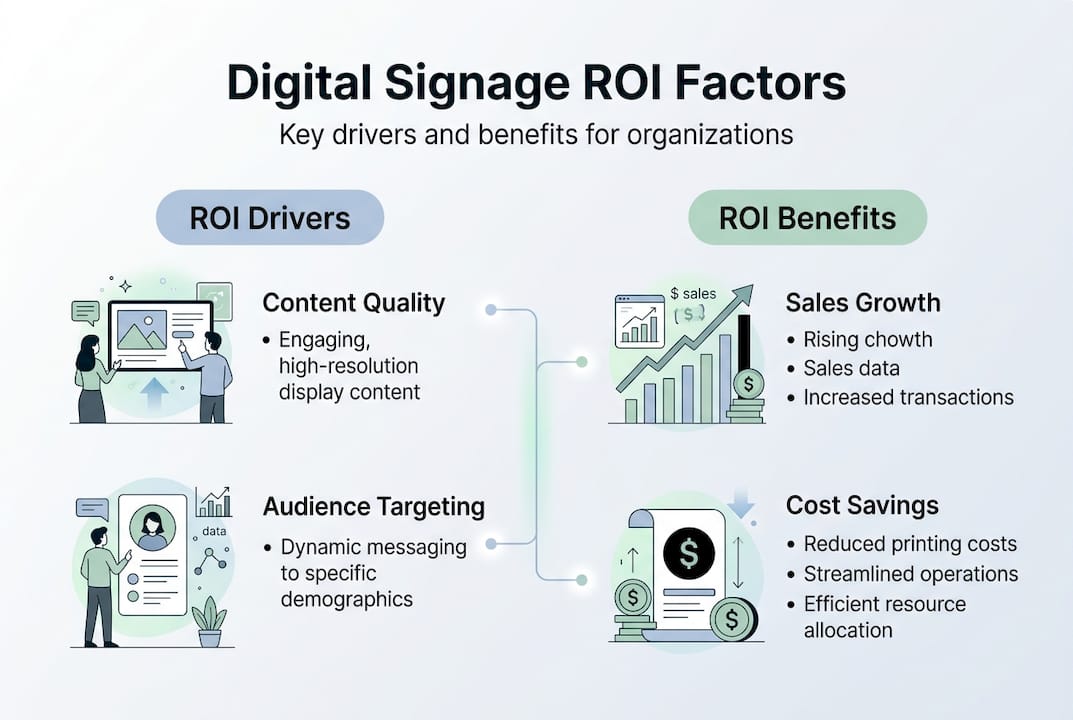
- Content quality, deployment scale, audience targeting, and system integration are key factors influencing ROI success.
Measuring the return on investment from digital signage trips up a surprising number of marketing managers and IT decision-makers. The numbers, however, tell a compelling story. Retail digital signage delivers an average sales uplift of 29.5% and ROI of up to 400% in the first year under effective deployment conditions. Yet many organizations still treat digital signage as a line-item cost rather than a strategic asset. This guide cuts through the confusion. You will learn what ROI actually means in the context of digital signage, how to benchmark your results against real industry data, and what steps you can take to measure and improve performance from day one.
Table of Contents
- What ROI means for digital signage
- Industry benchmarks and real-world impact
- Key factors influencing digital signage ROI
- How to measure and optimize digital signage ROI
- Why most organizations underestimate digital signage ROI
- Ready to maximize your digital signage ROI?
- Frequently asked questions
Key Takeaways
| Point | Details |
|---|---|
| Clear ROI definition | Understand how digital signage ROI is measured, including direct and indirect returns. |
| Benchmark ROI figures | Real-world industry benchmarks show 25-40% sales uplift and rapid payback for digital signage. |
| Influencing factors | Content quality, targeting, and integration are key drivers of digital signage ROI. |
| Optimization strategies | Practical frameworks and step-by-step methods can help track and maximize digital signage returns. |
What ROI means for digital signage
Return on investment (ROI) is the ratio of net gain to total cost, expressed as a percentage. For digital signage, the calculation sounds simple, but the reality is more layered. Unlike a paid ad campaign where clicks and conversions are tracked automatically, digital signage ROI blends hard financial metrics with softer operational benefits like employee engagement, customer dwell time, and brand perception.
For marketing managers, ROI typically centers on revenue impact: did signage drive more sales, increase average transaction value, or reduce the cost of printed materials? For IT decision-makers, the focus shifts toward total cost of ownership, system reliability, and integration complexity. Both perspectives matter, and a strong ROI case addresses both audiences.
Here is a quick comparison of how ROI differs between internal and external digital signage use cases:
| Use case | Primary ROI driver | Secondary benefit |
|---|---|---|
| Retail displays | Sales uplift | Reduced print costs |
| Corporate communications | Employee engagement | Faster information flow |
| Quick-service restaurants (QSR) | Ticket size increase | Menu flexibility |
| Healthcare facilities | Patient satisfaction | Staff efficiency |
| Education campuses | Communication reach | Event promotion |
Some key points to keep in mind when defining ROI for your deployment:
- ROI is not a single number. It is a range influenced by content quality, hardware choices, and audience context.
- Indirect benefits like reduced print spend or faster onboarding often go uncounted, which underestimates total return.
- Payback periods range from 6 to 36 months, with average ROI sitting between 35% and 52% across sectors.
- Both short-term and long-term returns should be modeled before investment decisions are made.
Pro Tip: Build a two-column ROI model from the start. Column one tracks direct financial returns (sales lift, cost savings). Column two tracks operational and engagement gains. Combining both gives you a defensible business case that resonates with finance, marketing, and IT stakeholders simultaneously.
With ROI more clearly defined, let’s explore industry benchmarks and the measurable impact organizations experience.
Industry benchmarks and real-world impact
Numbers ground strategy. Before you can optimize your digital signage investment, you need to know what good looks like across your industry. The data available in 2026 paints a strong picture for organizations willing to deploy thoughtfully.
“Retail sales uplift ranges from 25% to 40%, employee engagement gains reach 22% to 37%, and QSR ticket lift lands between 18% and 32%.” Source: Digital Signage Benefits Statistics
Here is how those impact statistics break down by sector:
| Sector | Typical ROI range | Payback period | Key metric |
|---|---|---|---|
| Retail | 35% to 400% | 6 to 18 months | Sales uplift |
| QSR | 25% to 120% | 6 to 12 months | Ticket size |
| Corporate | 30% to 80% | 12 to 24 months | Engagement lift |
| Healthcare | 20% to 60% | 18 to 36 months | Patient satisfaction |
Several patterns emerge from this data that are worth highlighting:
- Retail consistently outperforms other sectors in first-year ROI because signage directly influences purchase decisions at the point of sale.
- QSR environments benefit from dynamic menu boards that allow real-time pricing and promotion changes, reducing operational friction.
- Corporate environments show slower financial ROI but strong engagement gains that reduce turnover costs over time.
- Healthcare facilities often undercount ROI because patient satisfaction improvements are not always linked back to signage investments in financial reporting.
The takeaway is clear: sector context shapes what you measure and how quickly you expect returns. Organizations that align their KPIs with sector-specific benchmarks are far more likely to demonstrate a credible ROI case to leadership. Understanding the impact leads us to the crucial question: what factors actually drive digital signage ROI?
Key factors influencing digital signage ROI
Not all digital signage deployments perform equally. The gap between a 35% ROI and a 400% ROI is not luck. It comes down to a set of controllable factors that marketing managers and IT leaders can influence directly.
Content relevance and quality
Content is the single biggest lever. Static, generic content performs poorly. Dynamic content that responds to time of day, audience segment, or real-time data consistently outperforms. A retail display showing a lunch promotion at 11:45 AM converts far better than one cycling through a generic brand loop.
Deployment scale and hardware investment
Scale matters for unit economics. A single screen in a break room delivers limited return. A coordinated network of displays across multiple locations creates compounding value. Hardware quality also affects ROI indirectly: unreliable screens create maintenance costs and erode trust in the system.

Audience segmentation and messaging
The right message to the wrong audience produces no return. Effective deployments map content to specific audience profiles at specific locations. A hospital lobby audience has different informational needs than a hospital staff corridor audience, and content strategy should reflect that.
Integration with IT infrastructure
Signage that connects to existing data systems, CRM platforms, or inventory feeds becomes exponentially more valuable. Corporate employee engagement increases by up to 37% when signage is integrated with internal communications systems rather than operated as a standalone tool.
Additional factors that influence ROI include:
- Scheduling precision: content shown at the right time drives higher engagement rates.
- Multi-user management: teams that can update content quickly respond faster to market changes.
- Analytics and reporting: deployments with built-in performance tracking improve faster than those operating blind.
Pro Tip: Audit your current content refresh frequency. If your screens are showing the same content for more than two weeks without updates, you are almost certainly leaving ROI on the table. Dynamic content scheduling is one of the fastest ways to lift performance without additional hardware spend.
To unlock the full value of digital signage, let’s turn to practical strategies for measuring and optimizing ROI.
How to measure and optimize digital signage ROI
Measuring ROI from digital signage requires a structured approach. Without a clear framework, it is easy to collect data without drawing actionable conclusions. Here is a step-by-step method that works across sectors.
- Define your baseline. Before any screen goes live, document the current state of the metric you want to improve. If you are targeting sales uplift, record average weekly revenue per location. If you are targeting engagement, survey employees or track current communication open rates.
- Set specific, time-bound targets. Vague goals produce vague results. Aim for something like “increase average transaction value by 15% within 90 days of launch” rather than “improve sales.”
- Identify your measurement tools. Point-of-sale data, foot traffic counters, employee survey platforms, and CMS analytics dashboards are all valid inputs. Choose tools that can isolate the impact of signage from other variables where possible.
- Track costs completely. Include hardware, software licensing, content creation, installation, and ongoing maintenance. Partial cost tracking inflates ROI figures and creates credibility problems when results are reviewed.
- Calculate ROI at defined intervals. Monthly reviews during the first quarter, then quarterly reviews thereafter, give you enough data to spot trends without over-reacting to short-term noise.
- Optimize based on findings. Use analytics to identify which content performs best, which screens underperform, and which time slots drive the highest engagement. Then adjust scheduling and content accordingly.
The payback period averages 6 to 12 months for well-managed digital signage investments, which means most organizations should expect to reach breakeven within a single fiscal year if deployment is handled correctly.
Pro Tip: Set up a simple ROI dashboard in your existing reporting tool (Excel, Power BI, or Google Sheets all work). Track three numbers weekly: revenue impact, content update frequency, and screen uptime. These three metrics alone will surface 80% of the optimization opportunities available to you.
Why most organizations underestimate digital signage ROI
Here is an uncomfortable truth: most ROI analyses for digital signage are incomplete, and they are incomplete in a way that systematically undervalues the investment.
Organizations typically count what is easy to count. Sales uplift from a specific promotion. Print budget savings. Those are real, but they represent only a fraction of total return. What rarely gets counted is the compounding value of consistent brand reinforcement, the reduction in staff time spent answering repetitive questions because a screen answered them first, or the recruitment signal sent to candidates who walk into a modern, well-communicating workplace.
In retail settings, ROI can reach 400% in the first year when deployment is genuinely strategic. But that figure assumes organizations are capturing the full value picture, not just the obvious revenue line.
The lesson for marketing managers and IT leaders is this: build your ROI model to include indirect and operational benefits from the beginning. If you wait until deployment to figure out how you will measure intangible gains, you will never capture them. Define the full value map before the first screen goes live, and you will almost certainly discover that your digital signage investment is performing better than your reports currently suggest.
Ready to maximize your digital signage ROI?
DST Connect is built for exactly this challenge. Whether you are deploying ten screens or ten thousand, the platform gives you the tools to drive measurable returns from day one. The digital signage software includes real-time data feeds, automated scheduling, and a drag-and-drop editor that keeps content fresh without requiring design expertise. Pair it with compatible digital signage hardware across Android, Windows, and URL-based players for a flexible, scalable setup. Need help getting started? The signage setup resources walk you through every step. Try DST Connect and see how quickly a well-structured deployment moves from cost line to strategic asset.
Frequently asked questions
How is digital signage ROI calculated?
Digital signage ROI is calculated by comparing total returns, such as sales uplift or engagement improvements, to total investment costs over a defined measurement period. Both direct financial gains and indirect operational savings should be included for an accurate result.
What’s the typical payback period for digital signage?
Payback periods range from 6 to 36 months depending on deployment scale, sector, and content strategy. Retail and QSR environments tend to reach payback faster than corporate or healthcare deployments.
What factors most impact digital signage ROI in organizations?
Content relevance, audience targeting, hardware reliability, and system integration are the largest drivers of ROI. Employee engagement increases up to 37% when signage is integrated with internal communications rather than run as a standalone system.
How can ROI be improved after digital signage is deployed?
ROI improves most reliably through regular content updates, optimized scheduling based on audience behavior, and analytics-driven refinement of messaging. Organizations that review performance data monthly and adjust content accordingly consistently outperform those that set and forget their deployments, with payback averaging 6 to 12 months for actively managed systems.
Recommended
Enjoyed this blog?
Continue with the previous or next article and discover more ideas, insights and inspiration from DST Connect.